Toronto has been in Stage 3 of reopening for nearly five weeks now, and although things seemed to go smoothly as the city eased out of earlier pandemic restrictions, residents and officials are now preparing for a second wave as back-to-school and flu season loom.
Ontario has seen upwards of 100 new cases of COVID-19 per day for a full week now after a hopeful period during which new infection numbers were staying in the double digits and trending downward.
With Toronto being one of the urban centres responsible for the bulk of these new cases, some may be wondering which of our neighbourhoods have been hit the hardest.
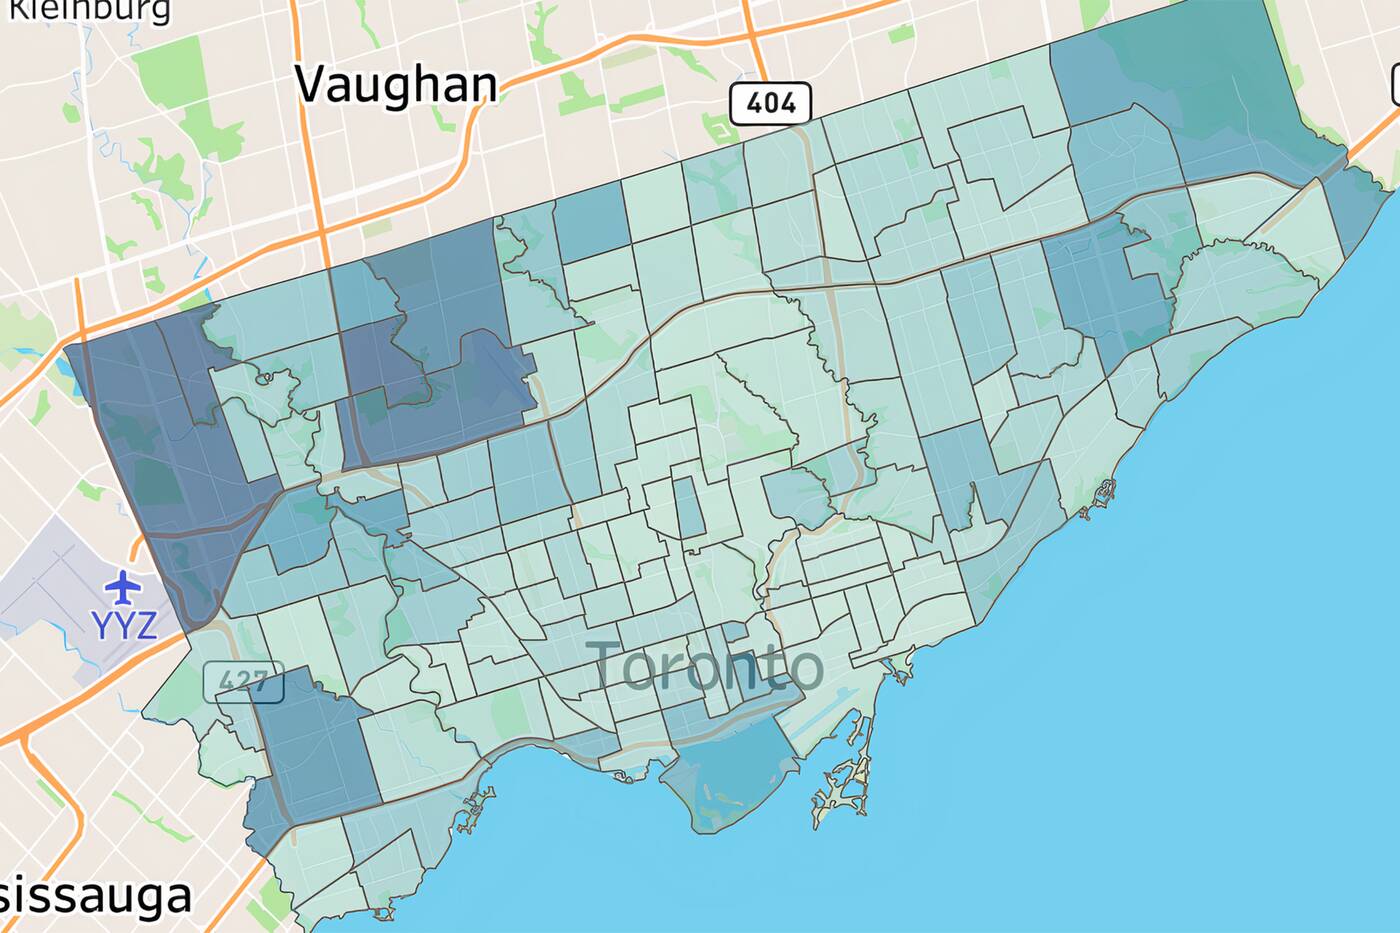
The City started releasing such data back in late May, and the current map looks pretty similar to how it did earlier in the pandemic, with low-income and racialized areas disproportionately affected.
But looking at new cases in the last 21 days only or the ratio of cases in a given part of the city in proportion to its population paint a different picture, albeit only slightly.
The top 10 COVID-19 hotspots in the City overall based on data from the onset of the pandemic until Sept. 2 are:
- Glenfield-Jane Heights 529 / 1,432 per 100,000 residents
- Mount Olive-Silverstone-Jamestown 526 / 1,596 per 100,000
- West Humber-Clairville 512 / 1,537 per 100,000
- Downsview-Roding-CFB 484 / 1,381 per 100,000
- York University Heights 439 / 1,591 per 100,000
- Islington-City Centre West 372 / 846 per 100,000
- Weston 339 / 1,884 per 100,000
- Woburn 324 / 606 per 100,000
- Rouge 321 / 690 per 100,000
- Kingsview Village-The Westway 318 / 1,445 per 100,000
 Where there have been the most cases over the duration of the health crisis, with darker areas representing a higher number. Map from the City of Toronto.
Based on the cumulative total number of cases, the northwest, northeast and southwest portions of the city have the highest figures.
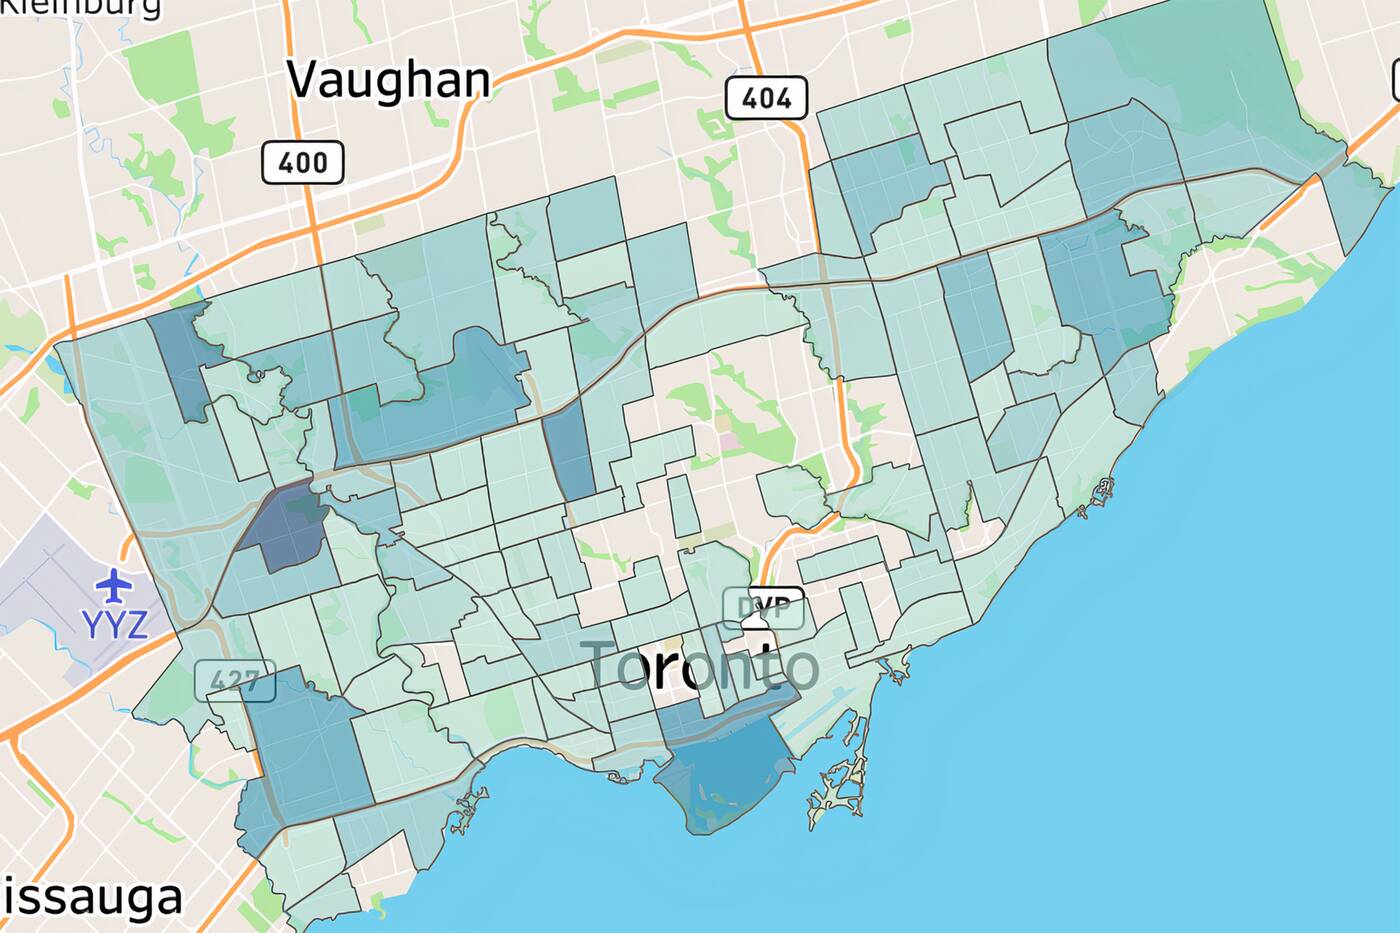
But, though Glenfield-Jane Heights has seen the most coronavirus patients, Kingsview Village-The Westway — which isn't in the top 10 locales overall — has seen the most in the past 21 days, with 30 residents testing positive.
For recent cases, Kingsview is followed by Mount Olive-Silverstone-Jamestown (22 cases), and then Englemount-Lawrence (20 cases), Waterfront Communities-The Island (18 cases). The latter two neighbourhoods are notably absent from the overall top 10.
And other areas with low cumulative case counts (not in the top 10) have rates of infection per 100,000 citizens that are in the top 10 for all parts of the city.
These neighbourhoods include Humber Heights-Westmount (196 cases, but 1,790 per 100,000 people — the second-highest ratio of all), Beechborough-Greenbrook (103 cases, 1,566 per 100,000), Guildwood (151 cases, 1,523 per 100,000), Maple Leaf (152 cases, 1,503 per 100,000), and Black Creek (312 cases, 1,435 per 100,000).
 Where there have been the most cases in the last 21 days alone, with darker areas representing a higher number. Map from the City of Toronto.
It is worth noting that these stats factor in outbreaks in institutions like long-term care homes and other communal living situations, and also may be influenced by testing rates across the city.
With new diagnoses nationwide being attributed to people partying and socializing, and a higher proportion of young people presenting with the virus, it will be interesting to see if and how the communicable disease's distribution across the city changes over time.
But no matter where new cases crop up, hopefully we can keep them controlled and keep these numbers down.
by Becky Robertson via blogTO

No comments:
Post a Comment